
ESG Benchmarking: How Companies Compare Their Performance, Why the Scores Disagree, and How to Use Them Well

ESG benchmarking is the practice of measuring a company's environmental, social, and governance performance against a reference point, usually its industry peers, using ratings, scores, and disclosure frameworks as the measuring stick. It is what turns a raw ESG figure into something meaningful, because a number on its own says little until it is set against what comparable companies achieve.
This guide covers what benchmarking is and the forms it takes, what the major ESG benchmarks actually measure, why their scores so often disagree, and how to use them without being misled.
ESG benchmarking at a glance
What it compares: a company's ESG performance against its peers, and against its own baseline over time
The measuring stick: ESG ratings and scores, read alongside the disclosure frameworks that feed them
The main sources: MSCI, Morningstar Sustainalytics, CDP, S&P Global, and ISS, among others
The catch: there is no single ESG standard, so different providers score the same company differently, and the divergence is the thing to understand
What ESG benchmarking involves
Benchmarking exists because an ESG metric has no meaning in isolation. A carbon intensity figure, a board-diversity percentage, or a safety rate only becomes useful when compared, either against peers in the same industry or against the company's own past performance. The comparison is what tells a company, an investor, or a regulator whether a result is strong, average, or weak.
It takes two forms that answer different questions. Internal benchmarking compares a company against its own baseline over time, which shows trajectory, whether performance is improving and how fast. External benchmarking compares a company against its peers, which shows standing, where it sits in its industry. Most programs use both: trajectory to manage progress, standing to understand how the market sees them.
The measuring stick is the set of ESG ratings and scores produced by specialized providers, read alongside the disclosure frameworks that structure the underlying data. Ratings give the comparison its common scale. The difficulty, and the reason benchmarking requires judgment rather than just a lookup, is that there is no universal ESG scoring standard, so the scale itself differs from one provider to the next.
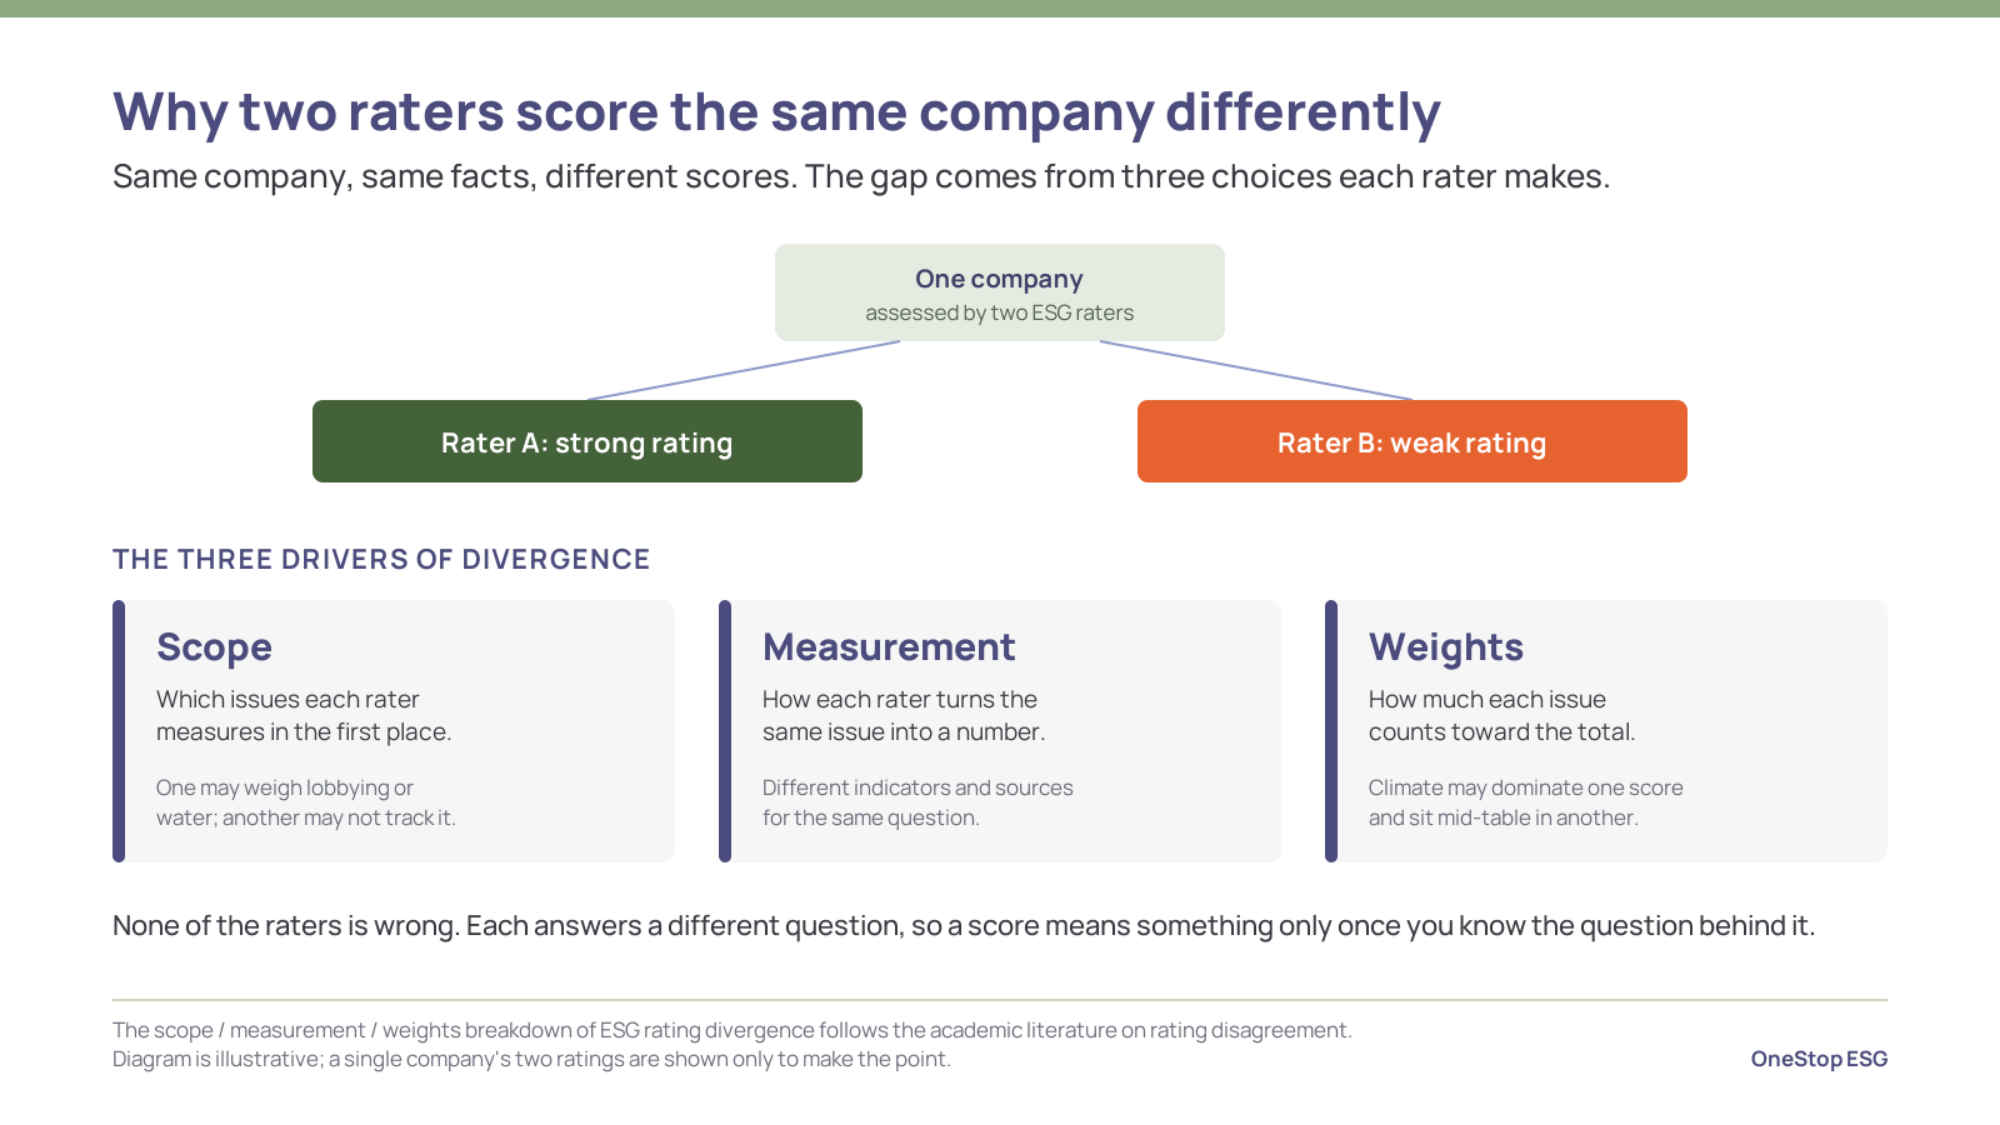
Figure: Why two raters score the same company differently.
What the major ESG benchmarks measure
The reason the scores differ starts with what each provider is trying to answer, because the major benchmarks are not measuring the same thing. MSCI's ESG ratings assess how well a company manages the ESG risks and opportunities that are financially material to its industry, scored relative to peers. Morningstar Sustainalytics takes a different angle, measuring unmanaged ESG risk, how much risk remains after a company's mitigation efforts, on a scale where a lower score is better. CDP scores the quality and completeness of a company's environmental disclosure rather than its performance as such.
Those are three distinct questions, and a company can land very differently on each without any of them being in error. Strong climate disclosure can lift a CDP score while broader governance or risk issues weigh on a risk-focused rating. A score that rates risk management relative to peers is not comparable, number for number, with one that measures residual risk on an absolute scale. Before a benchmark means anything, a company has to know which of these questions the provider asked and whether the score is relative or absolute.
Alongside the broad raters sit sector-specific benchmarks that compare performance within one industry on a consistent basis, such as the real-estate assessment that property funds report to. These narrow the peer group deliberately, which reduces one source of disagreement but does not remove the underlying issue: any benchmark reflects the choices of whoever built it.
Why the scores disagree
The disagreement is not a glitch at the edges; it is central and well documented. In the academic analysis of rating divergence by Berg, Koelbel, and Rigobon, ESG ratings from six major providers correlated on average around 0.54, ranging from roughly 0.38 to 0.71, whereas credit ratings from the main agencies correlate at about 0.99. Two companies can therefore hold a top-quartile rating from one provider and a bottom-quartile rating from another, which the CFA Institute's analysis of the major raters has also documented.
The same research traces the divergence to three causes. Scope is the set of issues each rater chooses to measure; one may track lobbying or water use that another ignores. Measurement is how each rater turns the same issue into a number, using different indicators and sources for the same question, and it is the largest single driver. Weights are how much each issue counts toward the total, so climate can dominate one score and sit mid-table in another. The three compound, which is why aggregate ESG scores diverge far more than their individual components might suggest.
Peer-group construction makes it worse. Because most ratings are relative, the score depends on who a company is compared against, and providers classify industries and build peer groups differently. The same company placed in a slightly different peer set can move several places in the ranking without changing anything it does. A benchmark is therefore only as meaningful as the peer group behind it and the question the rater set out to answer, which is why the methodology matters more than the headline figure.
How to use ESG benchmarking well
Benchmarking is useful when it is read as a question rather than a verdict, and that changes how a company approaches it.
It starts with matching the benchmark to the question. A company trying to understand its exposure to financially material risk, its disclosure quality, or its residual risk should choose the provider that measures that, rather than treating any single score as the truth. Reading the methodology before the score is the habit that separates useful benchmarking from being misled, because the methodology is what tells you what the number means and whether it is relative or absolute.
The peer group then has to be the right one. A benchmark against an ill-fitting peer set produces a ranking that reflects the classification more than the performance, so confirming the comparison set is part of using the result. Tracking the company's own trajectory matters as much as its rank, because a steady improvement against its own baseline is a signal the external score may lag. Specialist ESG ratings and data providers supply the underlying scores and peer data, and ESG advisory and strategy firms help interpret divergence and target the gaps that matter.
Finally, divergence is signal, not noise. When two reputable providers disagree sharply about the same company, the gap usually points to a genuine difference in what they measure, often a real strength on one dimension and a real weakness on another, and reconciling the two tells a company more than either score alone. Choosing ESG KPIs that map to the benchmarks a company is judged against, and preparing for an ESG audit of the data behind them, keeps the inputs sound so the comparison rests on figures the company can defend.
Common mistakes
-
Treating a single provider's rating as the definitive verdict, when each measures a different thing.
-
Reading the score without reading the methodology, so its meaning and whether it is relative or absolute stay unknown.
-
Benchmarking against the wrong peer group, which turns a performance comparison into an artifact of industry classification.
-
Chasing a higher score instead of the performance behind it, which optimizes for one rater's model rather than real improvement.
-
Comparing an absolute score against a relative one as if the two were on the same scale.
Conclusion
ESG benchmarking is most valuable when a company treats a benchmark as a question, not a verdict. A company that matches each benchmark to what it actually measures, reads the methodology and the peer group before the number, tracks its own trajectory, and uses divergence between providers as information can get a clear and defensible picture of where it stands. A company that takes one score as the truth is mistaking a single rater's question for the whole of its ESG performance.
Frequently asked questions
What is ESG benchmarking?
It is comparing a company's environmental, social, and governance performance against a reference point, usually its industry peers or its own past performance, using ESG ratings and scores. The comparison is what gives an ESG metric meaning, since a figure in isolation says little about whether it is strong or weak.
Why do ESG ratings disagree?
Because providers make different choices in three areas: which issues they measure, how they turn each issue into a score, and how much each issue counts toward the total. Measurement is the largest driver. Different peer groups add further divergence, so the same company can score very differently across providers.
Which ESG rating is the right one?
There is no single correct rating, because each measures a different thing: financially material risk management, residual unmanaged risk, or disclosure quality. The right benchmark is the one whose question matches what the company wants to understand, read with its methodology in view.
What is the difference between internal and external ESG benchmarking?
Internal benchmarking compares a company against its own baseline over time and shows trajectory. External benchmarking compares it against peers and shows standing in the industry. Most companies use both, because progress and position answer different questions.
How do you choose an ESG benchmark?
By starting from the question you need answered, choosing the provider or framework that measures it, confirming the peer group is a genuine fit, and reading the methodology so you know whether the score is relative or absolute before you rely on it.


