.jpg%3Falt%3Dmedia%26token%3D9c624ed6-7fe0-4d4a-9310-c7c511f2c221&w=3840&q=75)
How OneStop ESG took the activity already happening across its marketplace, every search, every click, every listing, and turned it into the live market picture this industry has never had.
The sustainability market has thousands of solution providers, a growing talent pool, hundreds of events, and more training programmes than anyone can track. The gap wasn't activity. It was visibility.
OneStop ESG built the ESG Market Intelligence Dashboard to fix that. It draws on observed user behaviour across the OneStop ESG marketplace, not surveys, not self-reported data, not annual estimates, and organises it into clear, filterable data across four modules: Marketplace, Jobs, Courses, and Events.
With over 90,000 monthly visitors, 200,000+ page views, over 2 million monthly impressions and users across 100+ countries, the platform draws on real behaviour, not surveys, to show where the market is actually moving.
What the Dashboard Offers and Where to Find It
The Market Intelligence Dashboard is available to all registered users for FREE on OneStop ESG. It can be accessed through the user profile dashboard and requires no additional subscription or setup. It comprises four intelligence modules: Marketplace Intelligence, Jobs Intelligence, Courses Intelligence, and Events Intelligence.

Each module provides summary metrics, geographic breakdowns, sector-level analysis, and engagement-based rankings. Users can filter by time period and, in several modules, by country, making it possible to zoom into specific markets or pull back to a global view.
Marketplace Intelligence
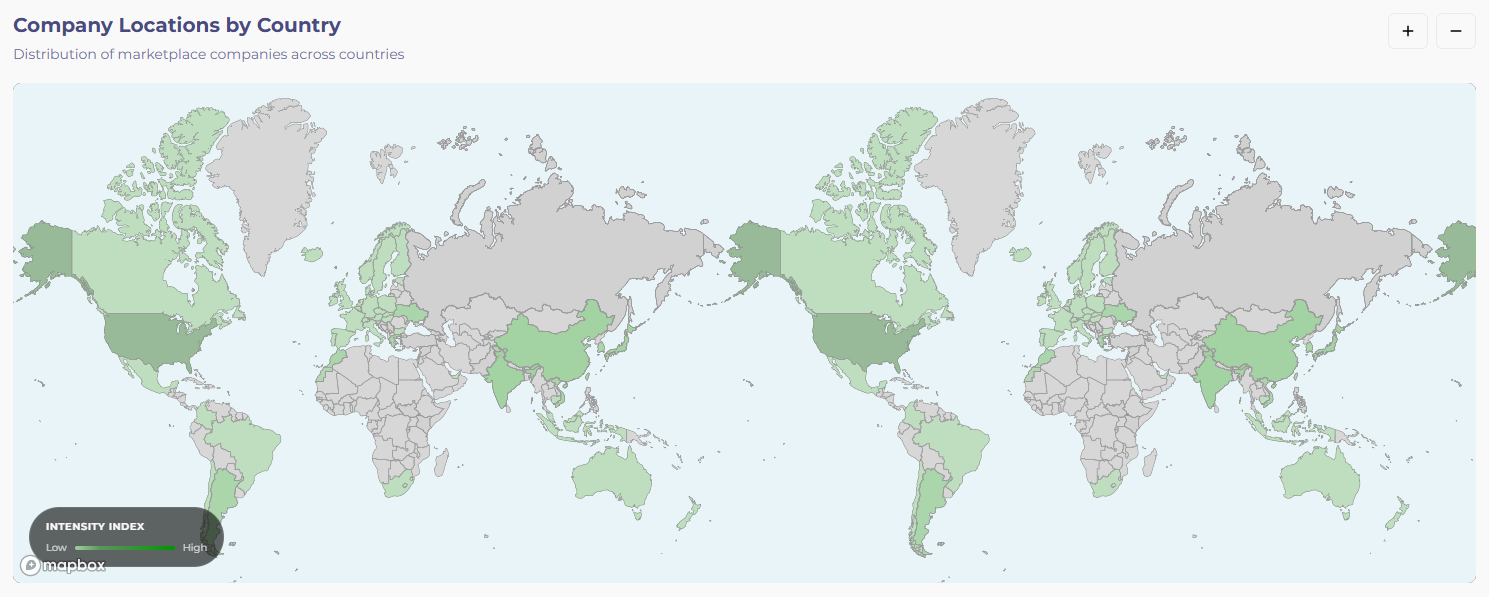
This is the platform’s deepest module. Five headline metrics give you the picture at a glance: total ESG and sustainability providers listed, new companies in the selected period, number of countries generating demand, the top company by user engagement, and total marketplace views.

A geographic breakdown shows where providers are concentrated. Corporate buyers can use this to find markets with strong provider clusters. Solution providers can spot where competition is heavy and where gaps exist.
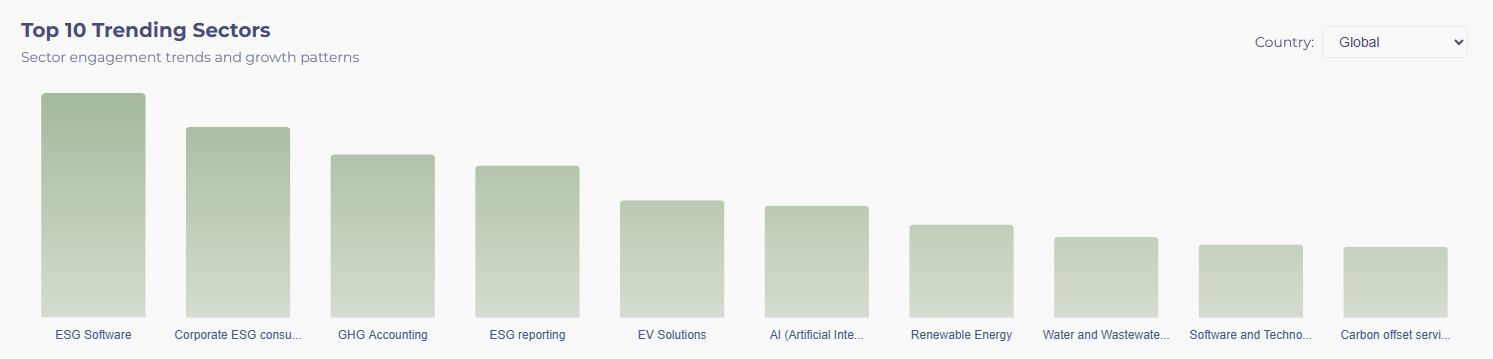
A top-ten sector ranking, filterable by country, shows which areas of ESG are drawing the most attention, whether carbon management, ESG reporting, supply chain sustainability, or biodiversity. Movement in this ranking over time can point to shifts in regulatory focus or corporate priorities.
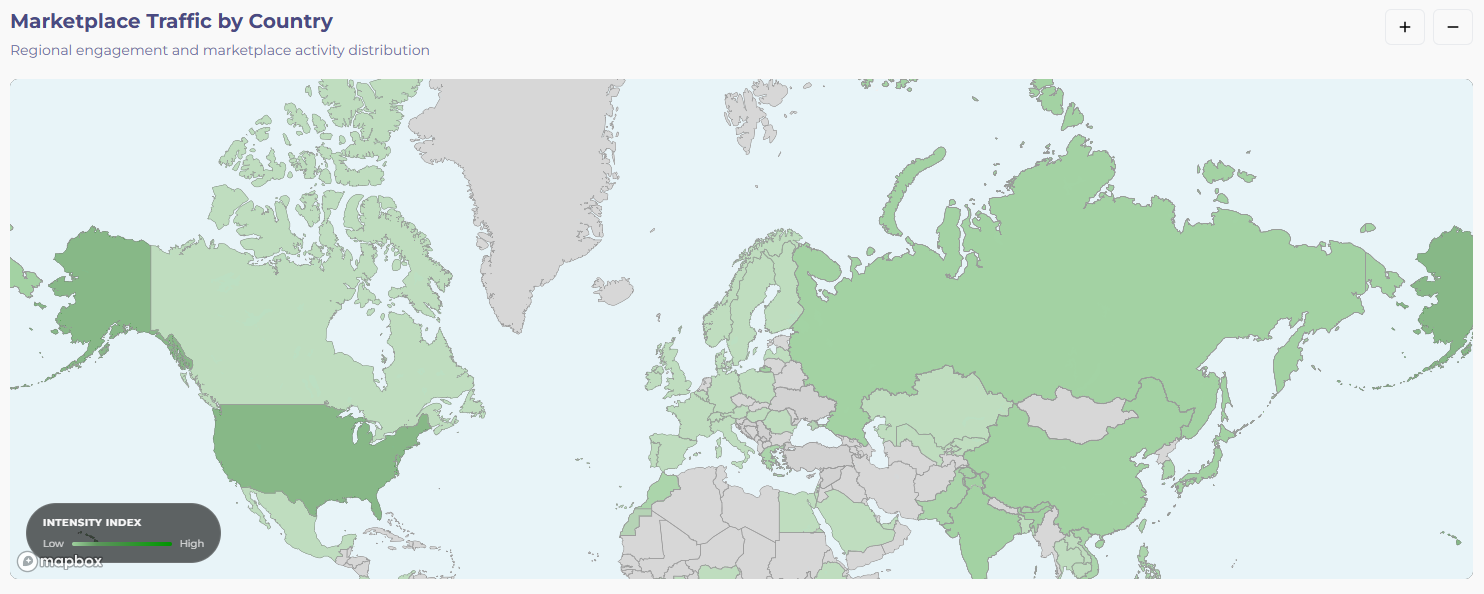
The demand-by-country metric flips the lens. It tracks where users are actively searching for solutions, showing where real purchasing interest sits by geography. A provider based in Germany might find strong demand from markets they hadn’t previously considered.
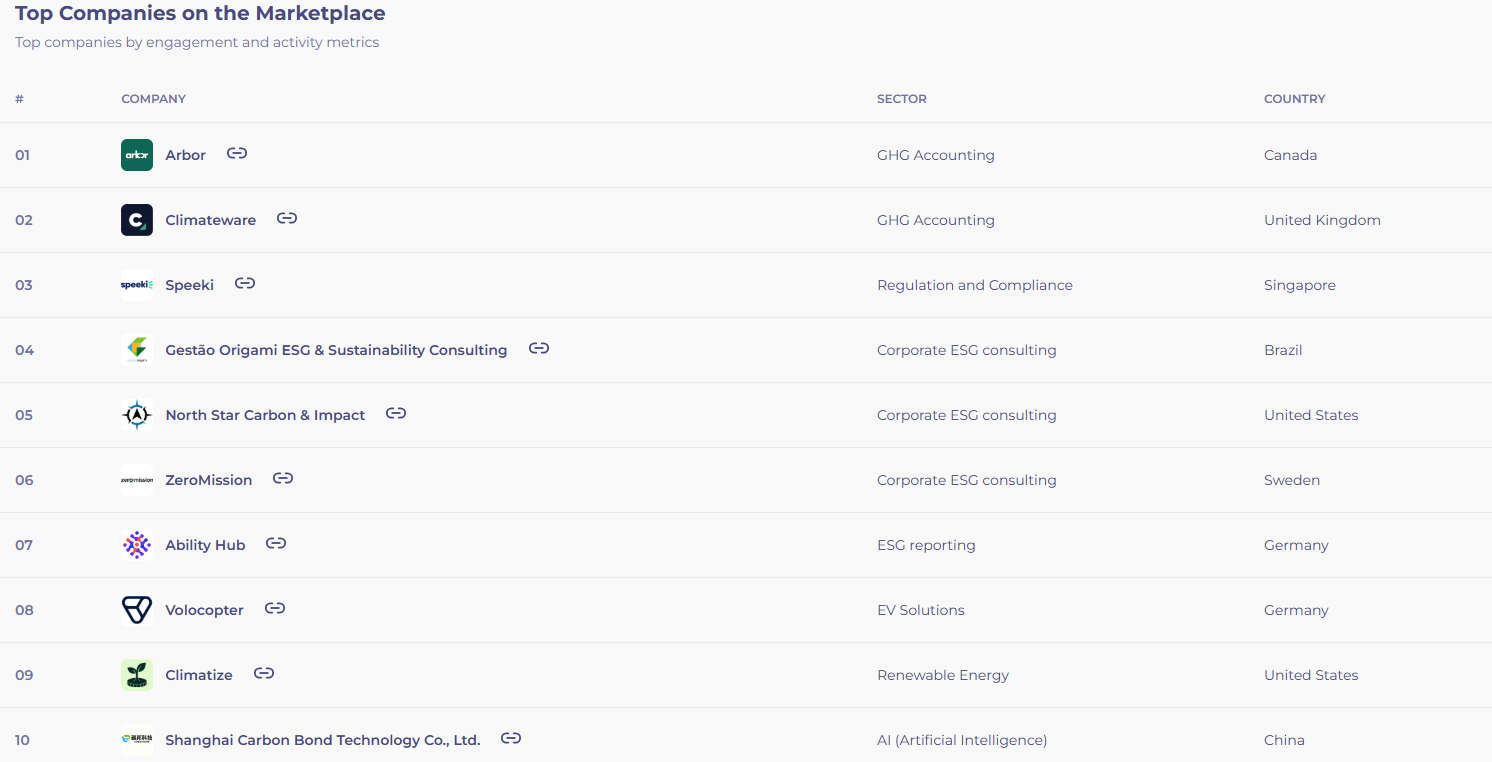
Two additional views show where things are heading. Top growing sectors tracks new company listings by category, a measure of momentum. Engagement by sector measures which categories get the most user interaction, separating sectors with many providers from those where buyers are actually clicking. A leaderboard ranks the top ten companies by engagement.
Who this helps
- Solution providers can see who they’re competing with, which countries drive demand, and where the underserved sectors are.
- Corporate buyers can discover growing sectors, compare providers by engagement, and select partners with more confidence.
- Investors can monitor market momentum across geographies and adjust financing priorities based on observed demand.
Jobs Intelligence
The jobs market is one of the best indicators of how seriously organisations are taking sustainability. This module tracks four headline figures: total job openings, openings in the selected period, the country leading talent demand, and the top skill in demand.

A ranking of the most-listed job titles shows which roles organisations are prioritising. An experience-level breakdown shows whether the market is building entry-level capacity or filling senior leadership gaps. A market heavy on senior openings suggests a shortage of experienced sustainability leaders. A surge in junior roles means ESG functions are being built out at scale.
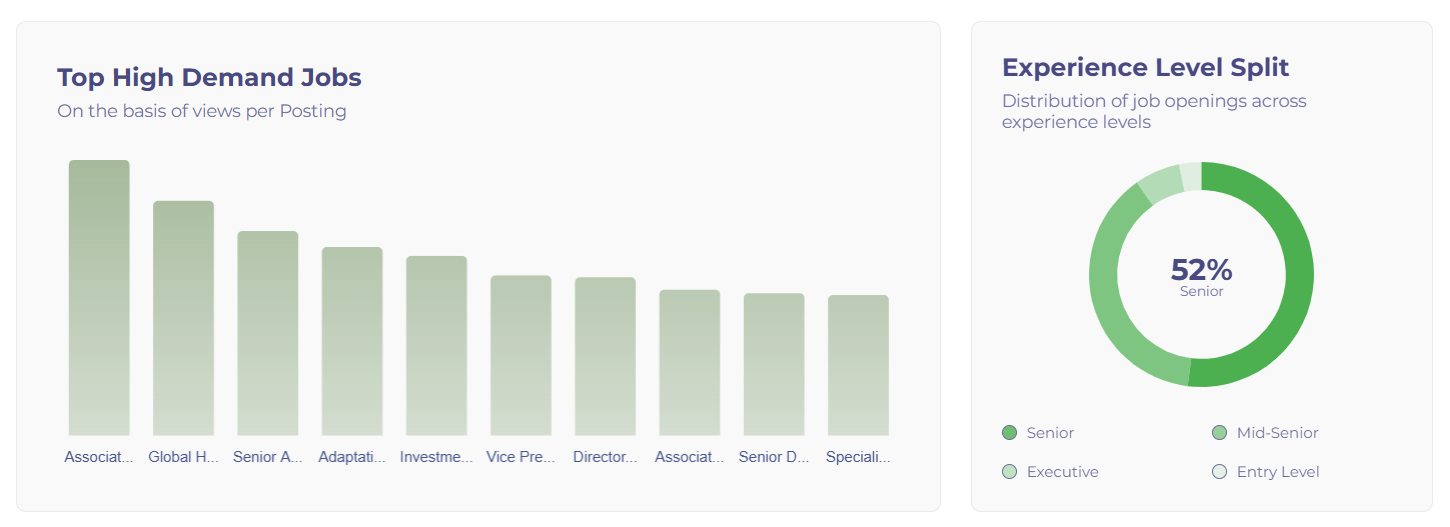
Specialisation data identifies the specific skills employers want, from supply chain due diligence to carbon accounting and ESG data analytics. A country-level ranking shows where hiring is most active globally.

Who this helps
- Employers can spot talent shortages and decide which skills to prioritise.
- Job seekers can target high-demand roles and understand where the openings are.
- Training providers can align curricula with the skills employers are actually hiring for.
Courses Intelligence
This module covers educational content on the OneStop ESG Educate platform. It shows what professionals are choosing to learn and which providers are delivering the most engaging content.
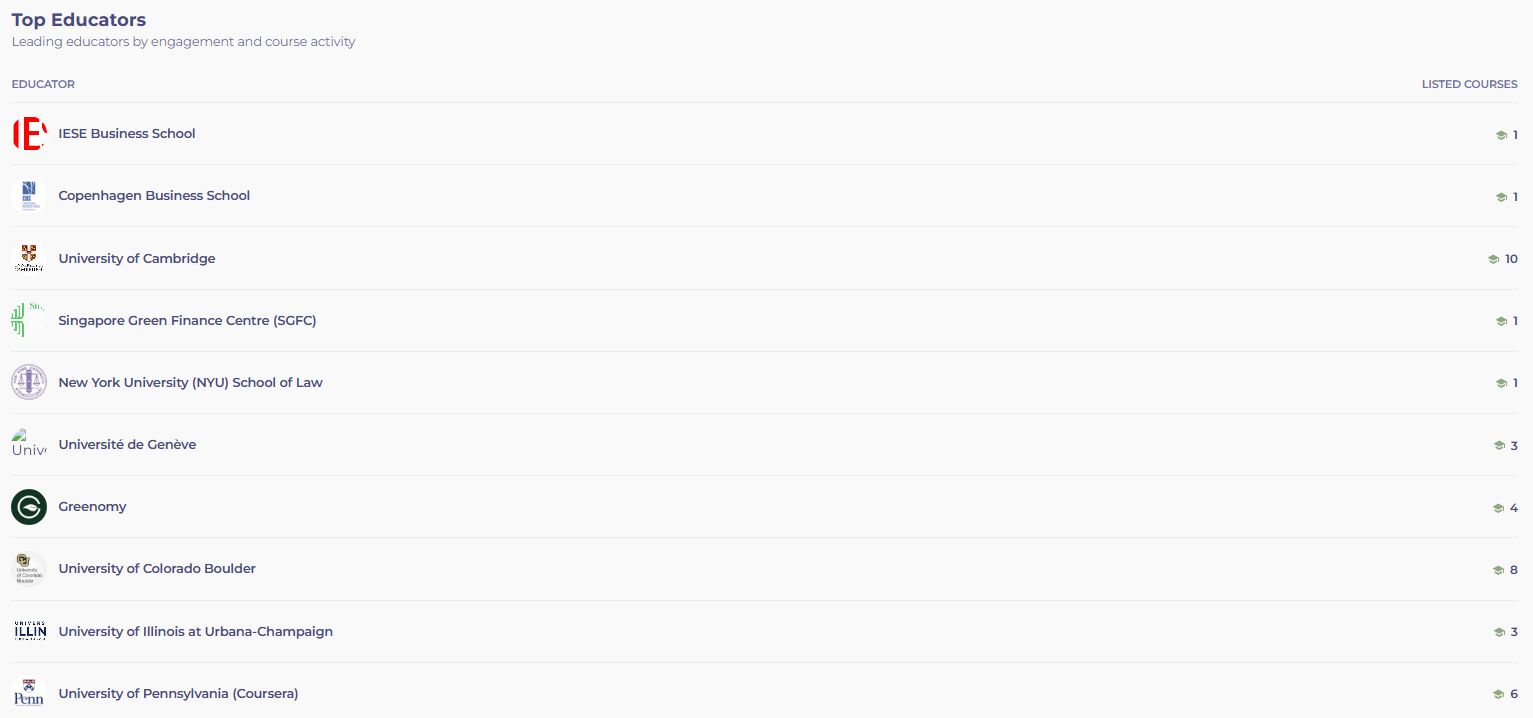
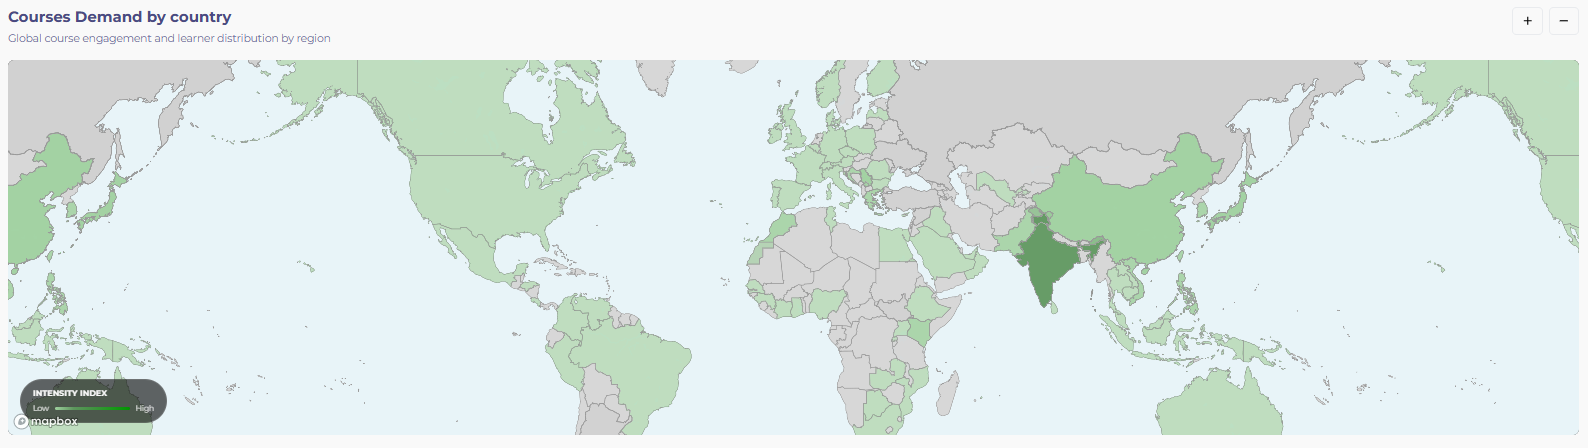
Top educators ranks course providers by user engagement. Top countries highlights where learner activity is strongest, a good indicator of where regulatory pressure or corporate sustainability programmes are pushing people to upskill. Top courses lists the most popular programmes by engagement, covering topics from greenhouse gas accounting to sustainability reporting standards.
Who this helps
- Corporate training managers can track which courses resonate and allocate budgets accordingly.
- Course providers can see what’s in demand and refine their content.
- Professionals can focus on courses aligned with skills that employers are hiring for right now.
Events Intelligence
Events remain central to how the ESG community shares knowledge and builds relationships. This module shows where professionals are engaging and which topics attract the most interest.
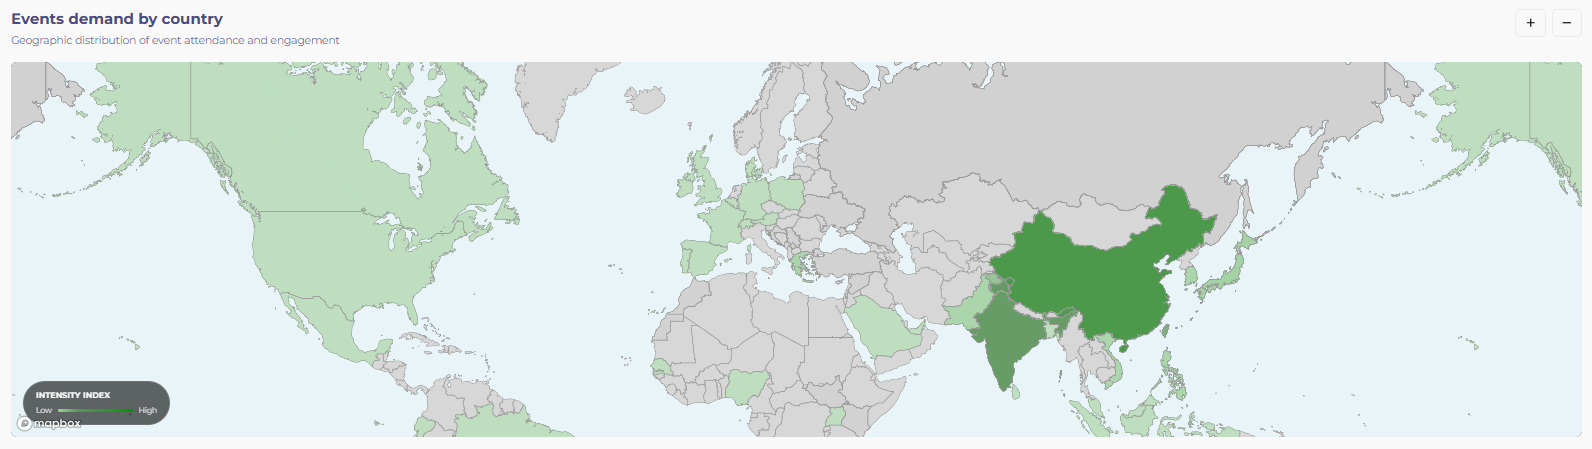
- Top countries shows where ESG event participation is strongest, often reflecting active policy discussions, corporate involvement, or growing local sustainability communities.
- Top events by engagement ranks conferences, webinars, and workshops by actual user participation, not just listings.
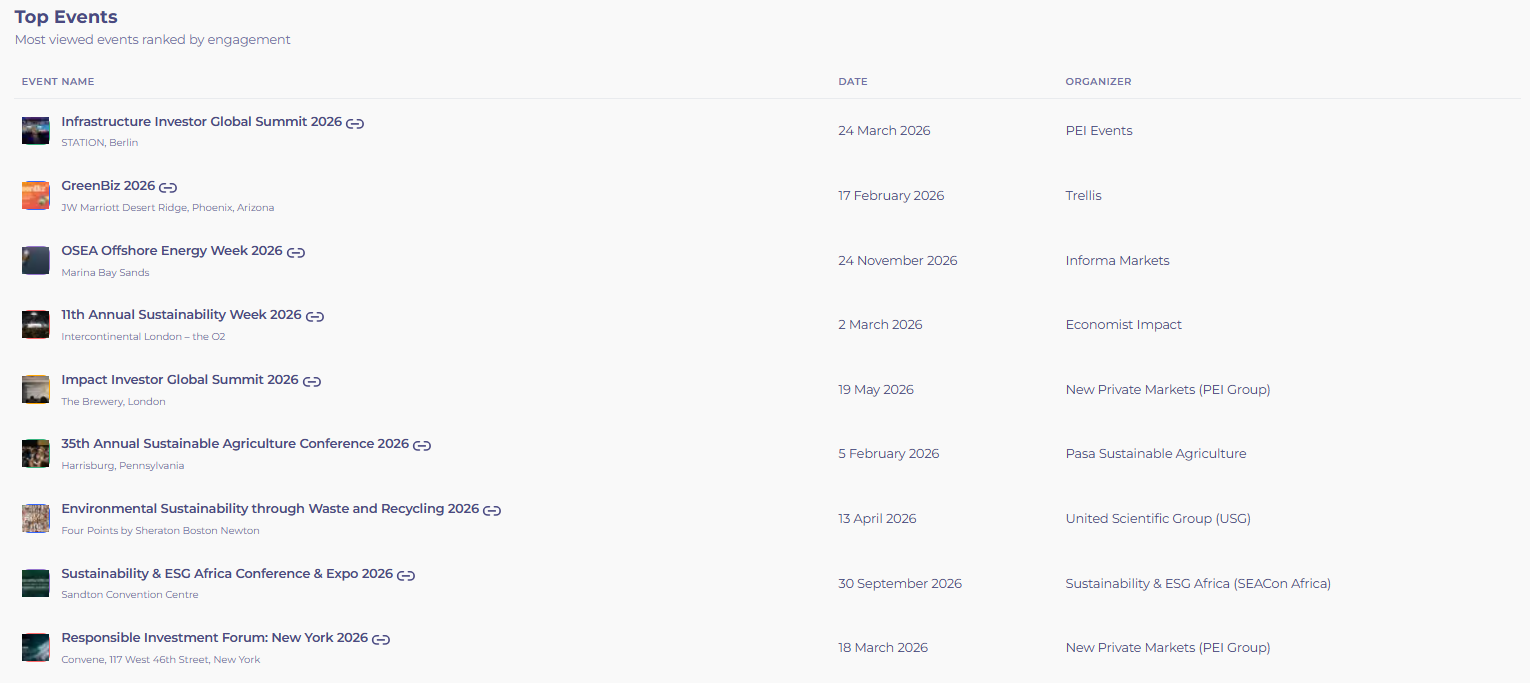
Who this helps
- Event organisers can benchmark their offerings and schedule events when demand is highest.
- Professionals can discover the gatherings that are genuinely drawing attention.
- Corporates can gauge which topics, from climate risk to circular economy, are picking up interest and plan their involvement.
Patterns Worth Watching
Because the platform runs on observed behaviour rather than periodic surveys, it picks up patterns that static reports miss:
- Demand doesn’t match supply everywhere. A sector might have dozens of providers but low user interaction, pointing to oversaturation or poor visibility. The platform makes these mismatches obvious.
- Regional demand shifts faster than expected. Regulatory timelines, supply chain pressure, and local climate policy create spikes in specific geographies. Country-level filtering picks these up as they happen.
- Skills gaps show up in the data before they show up in headlines. When job openings cluster around a specialisation that training programmes haven’t caught up to, employers and educators can act early.
Get Started
The ESG Market Intelligence Platform is now in early access. Log in to your OneStop ESG account, open the dashboard from your profile, and explore live data across 70+ sustainability categories.
This is observed market behaviour, updated continuously, covering solutions, talent, training, and events across the global sustainability market. No static reports. No guesswork. Just a clear view of where things are heading.
To Login to OneStop ESG Market Intelligence Dashboard - Click here


%252010th%2520Edition.png%3Falt%3Dmedia%26token%3D28295a93-506a-42b8-aef2-79cd319b0edc&w=3840&q=75)
Comments
Have a thought on this? Share it with other readers.