
Marketplace dashboards now give companies real-time insights on visibility, engagement, and sector benchmarks, turning listings into growth intelligence.
Turning Data Into Insights: Marketplace Companies Get Real-Time Dashboards
We’re excited to launch company dashboards on our marketplace giving every listed partner access to real-time intelligence on their performance.
For the first time, companies can go beyond static listings and truly understand how they’re being discovered, viewed, and engaged with.
Visibility at a Glance
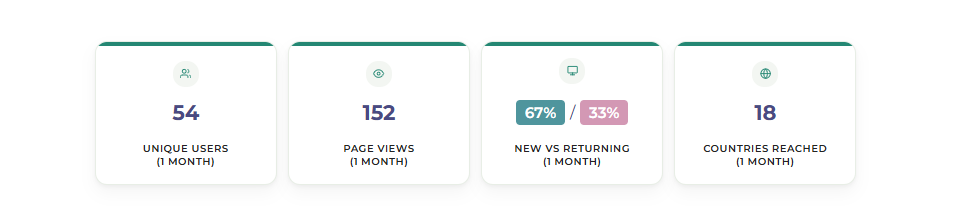
Dashboards show how people are interacting with your profile: how often your page is being viewed, the balance of new versus returning visitors, and the breadth of your global reach.
This helps companies see their visibility in action and understand how awareness is spreading across markets.
Tracking Activity Over Time
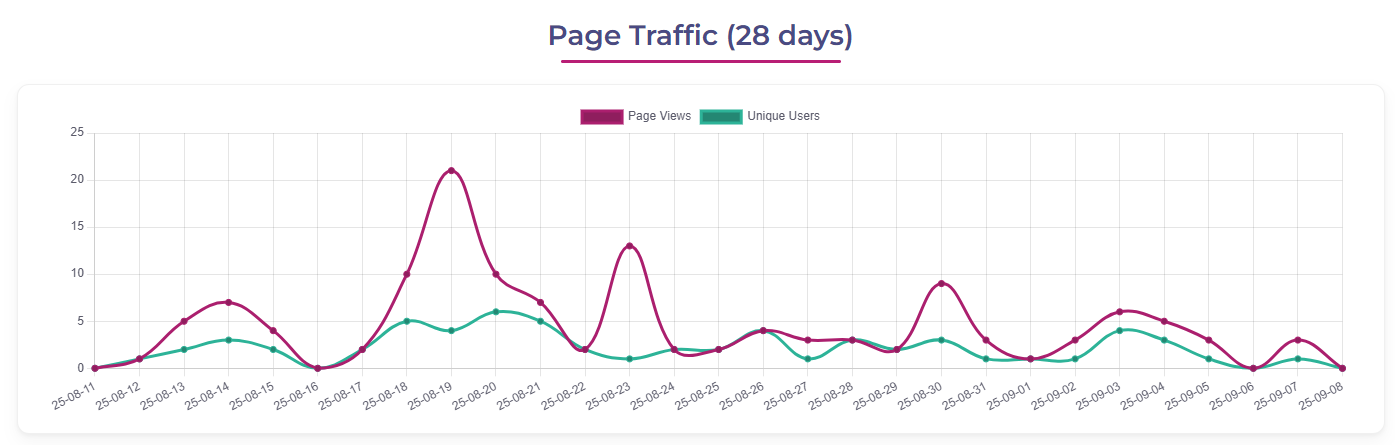
Traffic trends are displayed across days and weeks, making it easy to spot peaks and dips in engagement.
By linking these patterns with your own outreach such as campaigns, announcements, or events you can see what drives attention and when your audience is most active.
Benchmarking Against the Sector
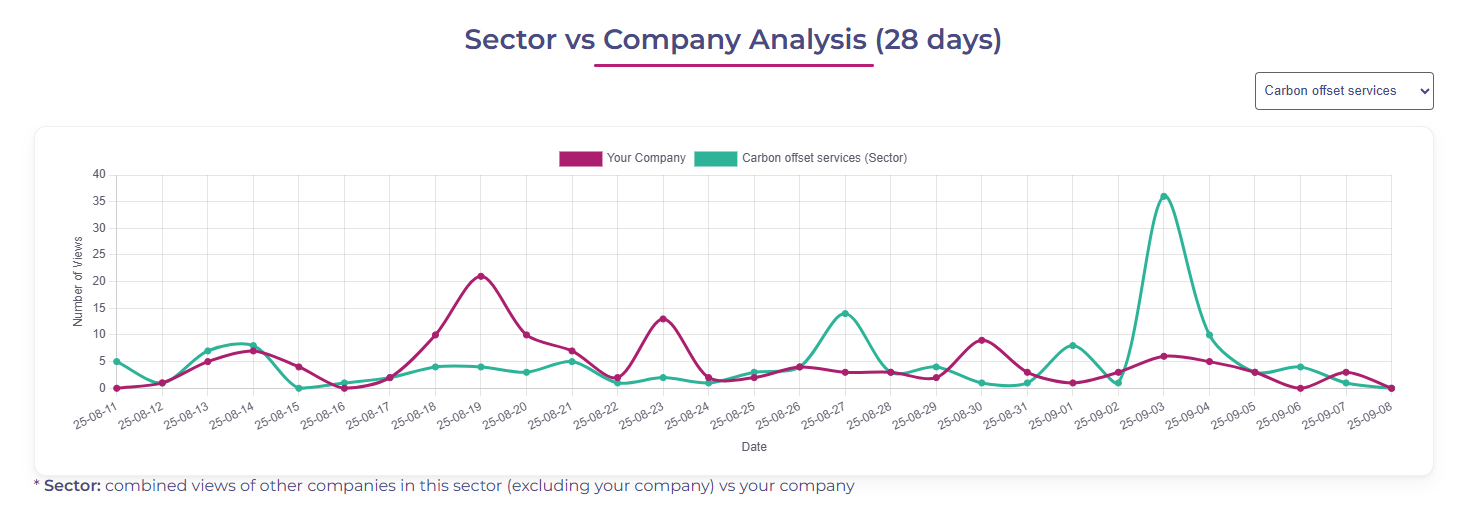
Dashboards don’t stop at your company’s numbers. They also compare your engagement with the wider sector.
This context shows whether interest in your profile is part of a broader trend or the result of your own efforts, giving you a clear benchmark against peers.
Mapping Geographic Reach
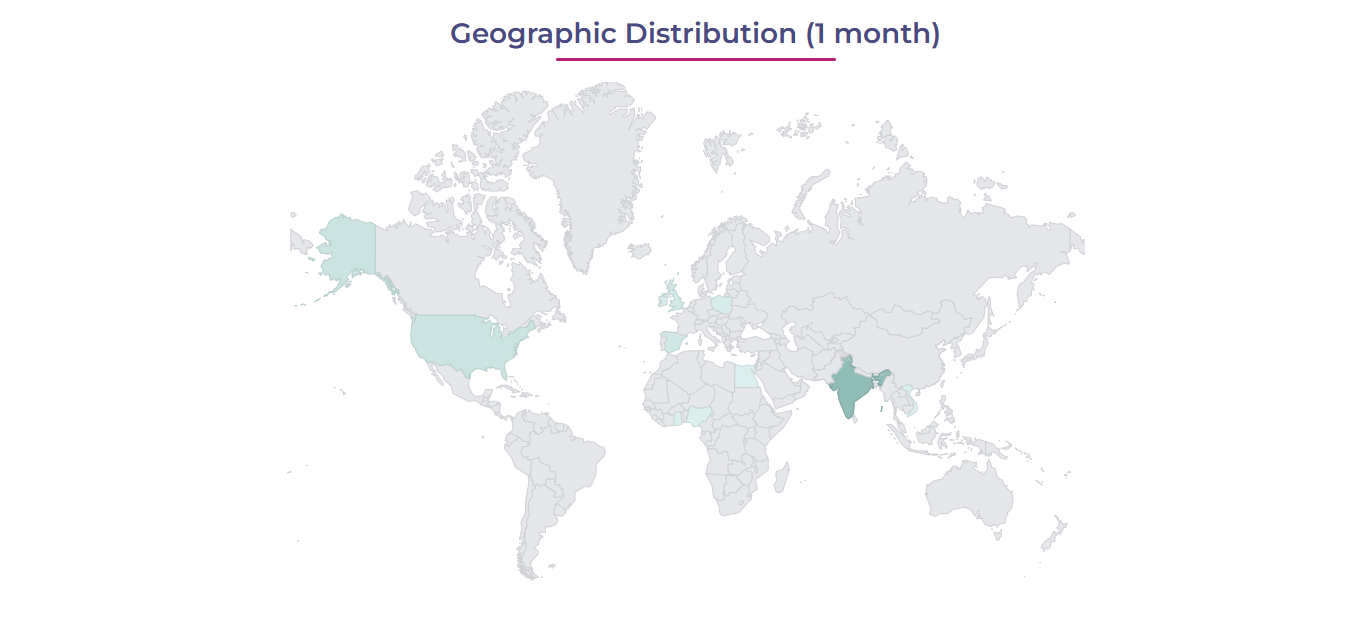
A world map highlights where visitors are coming from, showing whether your traction is concentrated in one region or spread across multiple markets.
For global players, this validates international reach. For regional companies, it reveals new markets with unexpected interest.
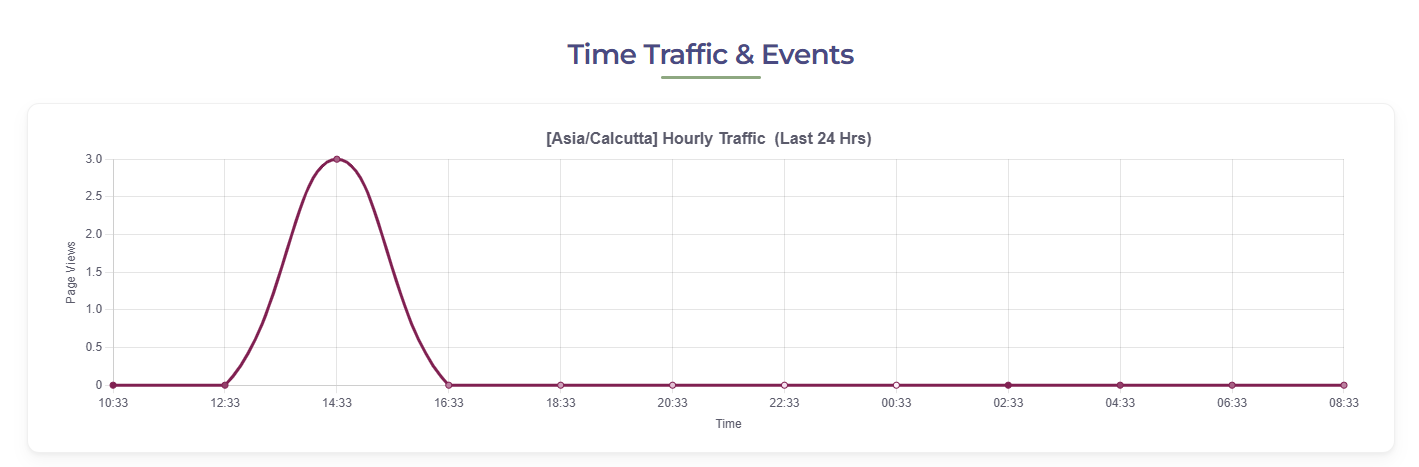
Knowing When Your Audience Engages
Hourly breakdowns show exactly when users are visiting your profile.
This allows you to align updates, outreach, or product launches with peak audience activity, making your actions more timely and effective.
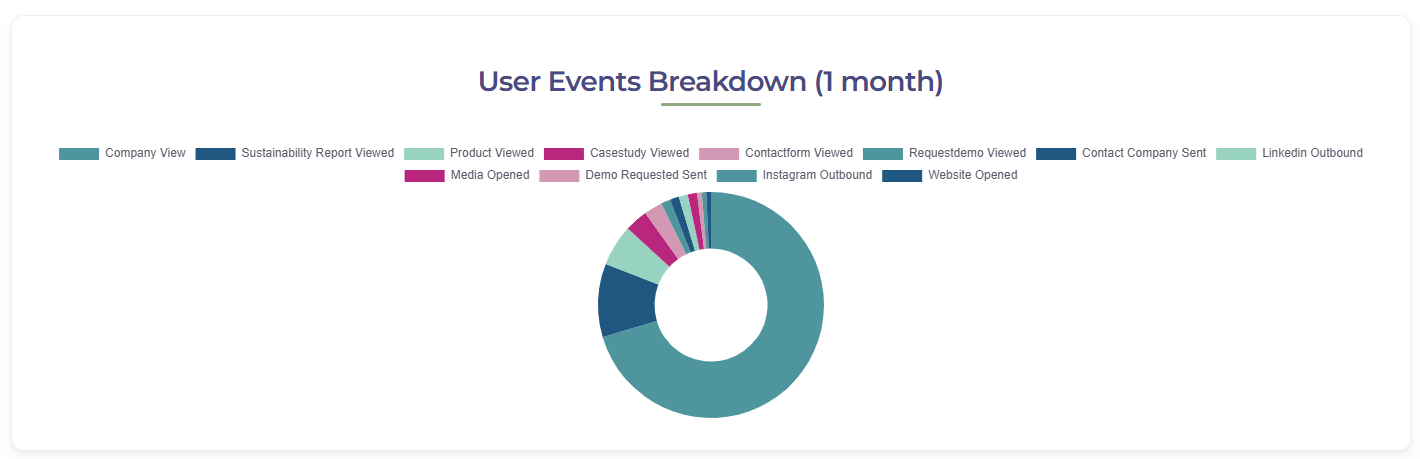
Understanding User Actions
Beyond visits, dashboards capture what users do on your page whether they view a product, open a case study, request a demo, or click through to your website.
This shift from raw visibility to meaningful actions gives companies clarity on what content resonates and what drives deeper engagement.
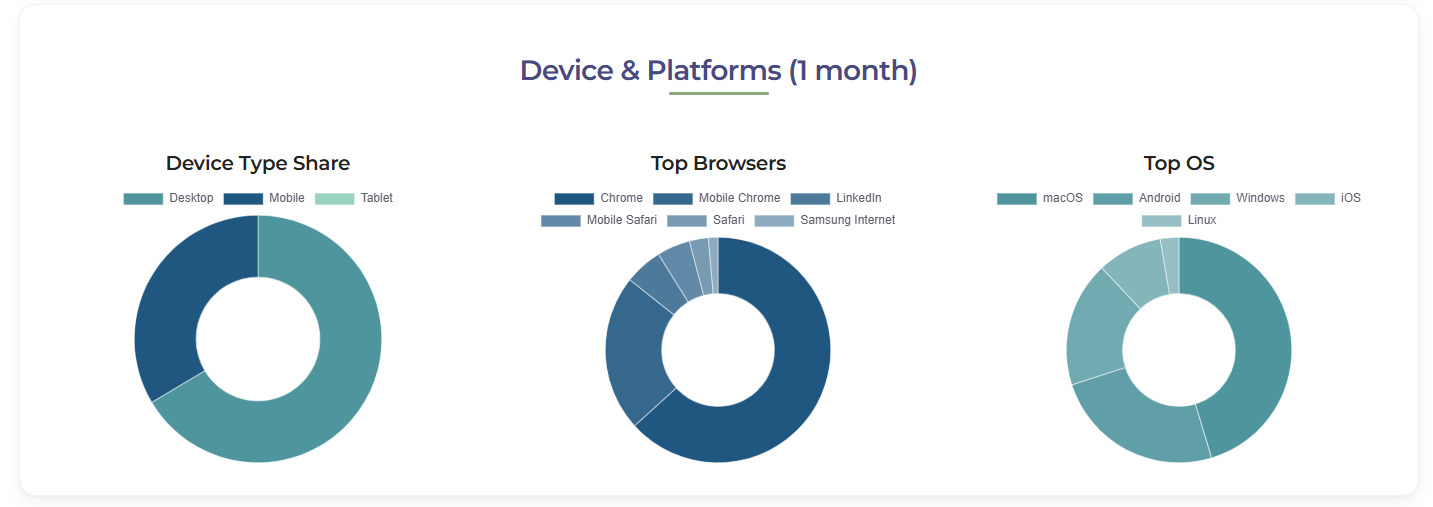
How Visitors Access You
Insights extend to devices, browsers, and operating systems.
You can see whether your audience prefers desktop or mobile, which browsers they use, and what systems they run.
This helps ensure your profile and content deliver a smooth experience for every type of visitor.
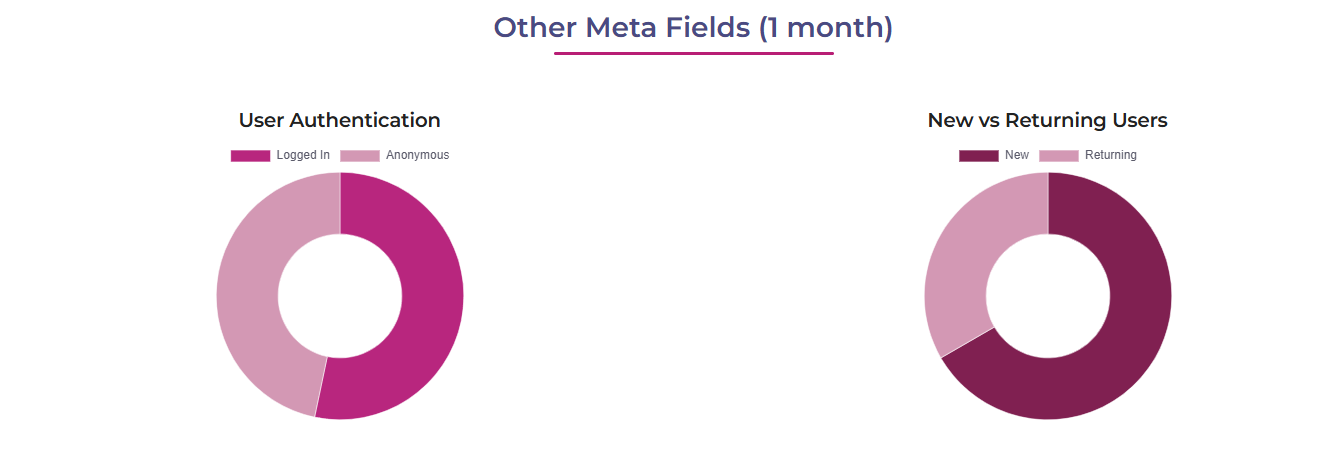
Building a Clearer User Profile
Finally, dashboards distinguish between logged-in and anonymous users, as well as new versus returning visitors.
This helps companies tell the difference between casual browsers and more committed prospects, while tracking how relationships with their audience strengthen over time.
What This Means for Your Business
With these dashboards, companies listed on our marketplace gain:
- Transparency into their visibility and reach
- Clarity on what actions users take and when
- Context through sector-level benchmarking
- Control over how to refine strategy and timing
Our goal is simple: to make every listing not just a profile, but a source of intelligence that helps companies grow smarter and connect better with their audience.
How to Access Your Dashboard
If your company is listed on our marketplace, getting access is simple:
- Log in using your Google or LinkedIn account.
- Send us an email at [email protected] from your official company address requesting dashboard access. This step ensures we can verify and correctly map company personnel to the right dashboard.
- Once our team confirms, you’ll be able to view your analytics directly in your profile dashboard, located in the top-right corner of our website.
With just these steps, your company can unlock real-time insights and start turning data into action.

.png%3Falt%3Dmedia%26token%3Dde36e88a-adff-4e6c-b934-1cd8a27fb28f&w=1920&q=75)
Comments
Have a thought on this? Share it with other readers.